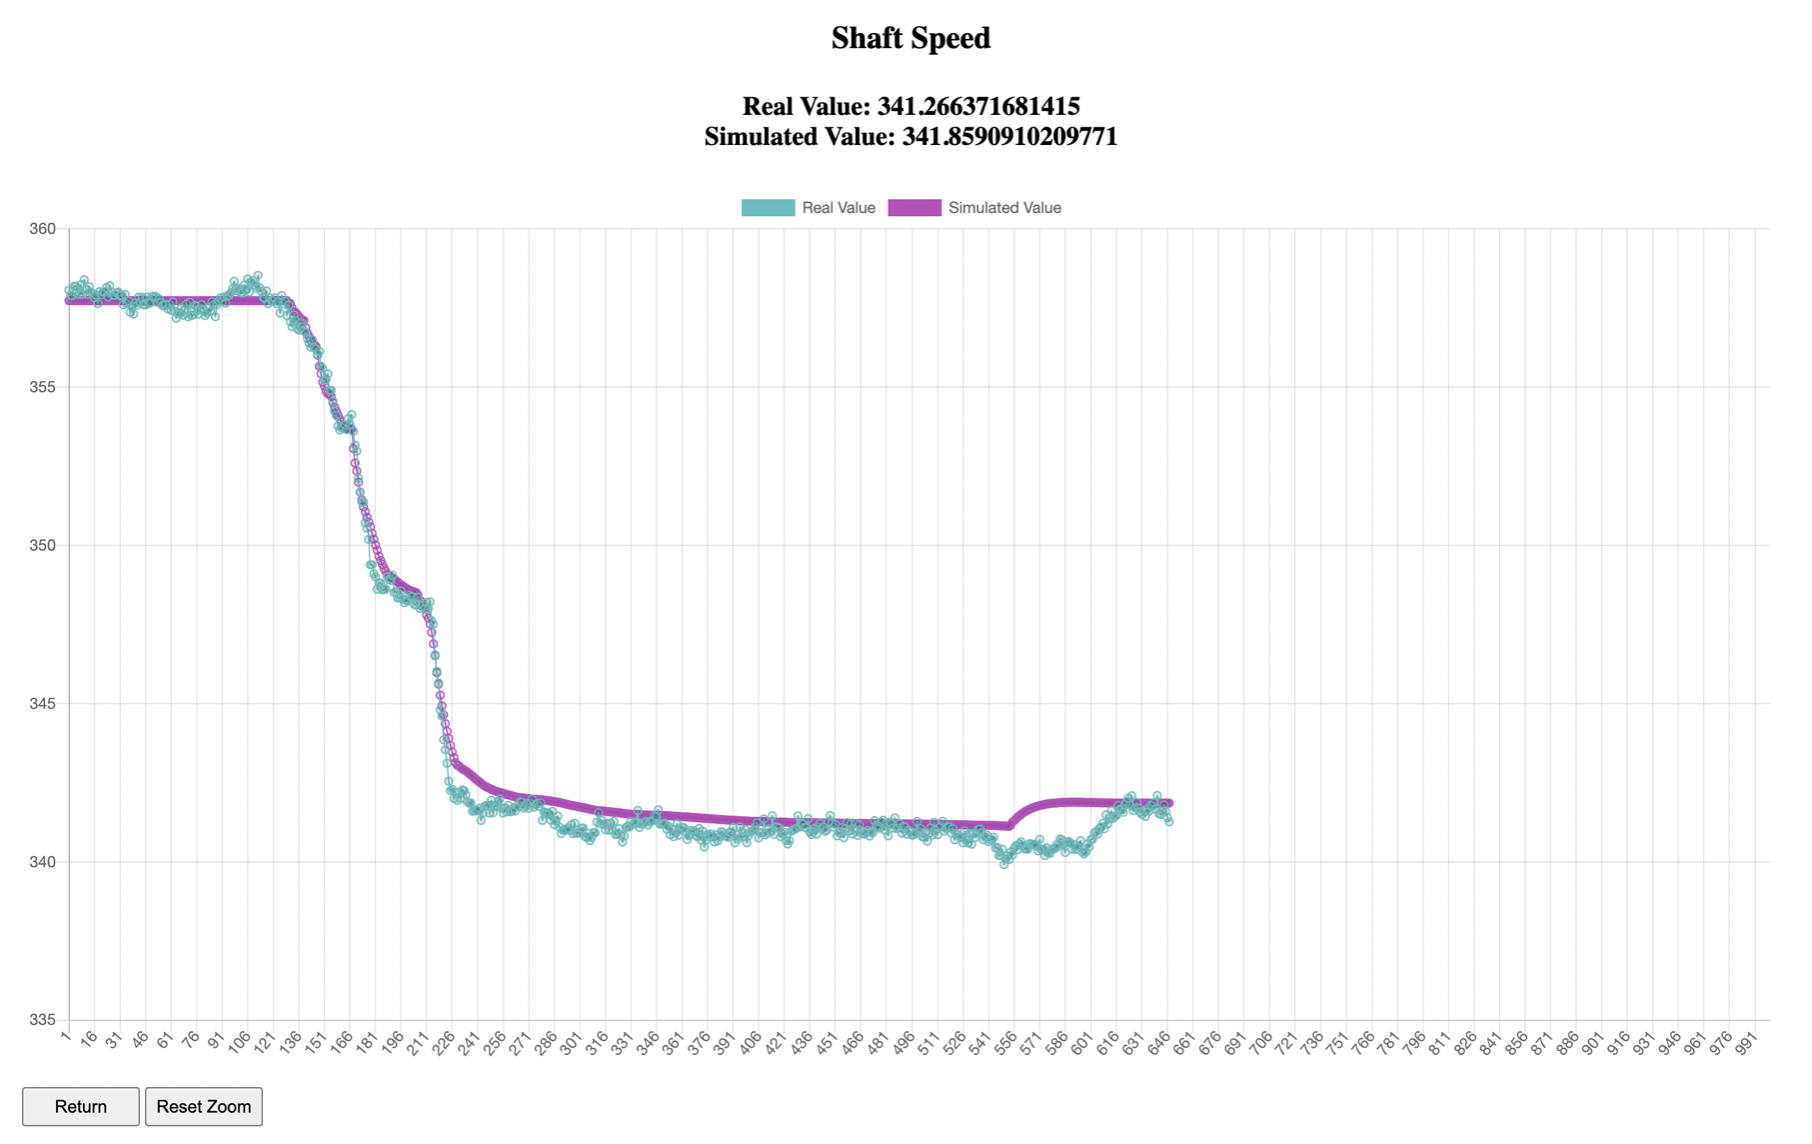
Chart.js Line Charts
In this post, we will discuss using Chart.js for line plotting. Examples from this post can be found in this repo. Reading data from a CSV file Here the full function we use to read in the data: function parseCSV(csv) { const lines = csv.split("\n"); const headers = lines[0].split(","); const data = { y_value: [], ym_value: [] }; for (let i = 1; i < lines.length; i++) { const currentLine = lines[i]....